

Water Shortages
Frequent extreme raw water shortages demand maximum delivery efficiency and physical loss reduction.
Hydraulic modelling, loss identification and predictive control for water distribution systems.
Challenges
Frequent extreme raw water shortages demand maximum delivery efficiency and physical loss reduction.

Specific treatment procedures are expensive, making lost non-revenue water a heavy financial burden.

Pumping water uses huge amounts of electricity, and its price is increasingly volatile.
Approach
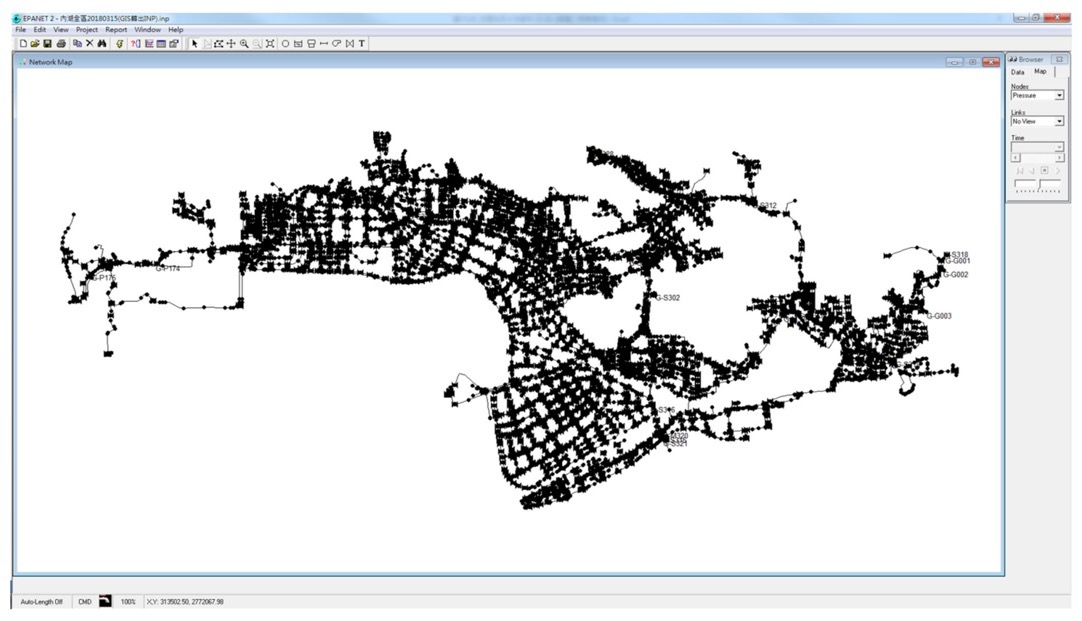
To optimize a water distribution system (WDS), exact parameter knowledge is essential. Physical attributes are directly imported from GIS into EPANET model.

Uses historical pressure & flow measurements from District Metered Area (DMA) zone inlets.

Correlates DMA inflows with billed demand to identify physical leakage coefficients.

Solves complex grey-box mathematical models while honoring strict pressure limits.
EPANET + Dashboard
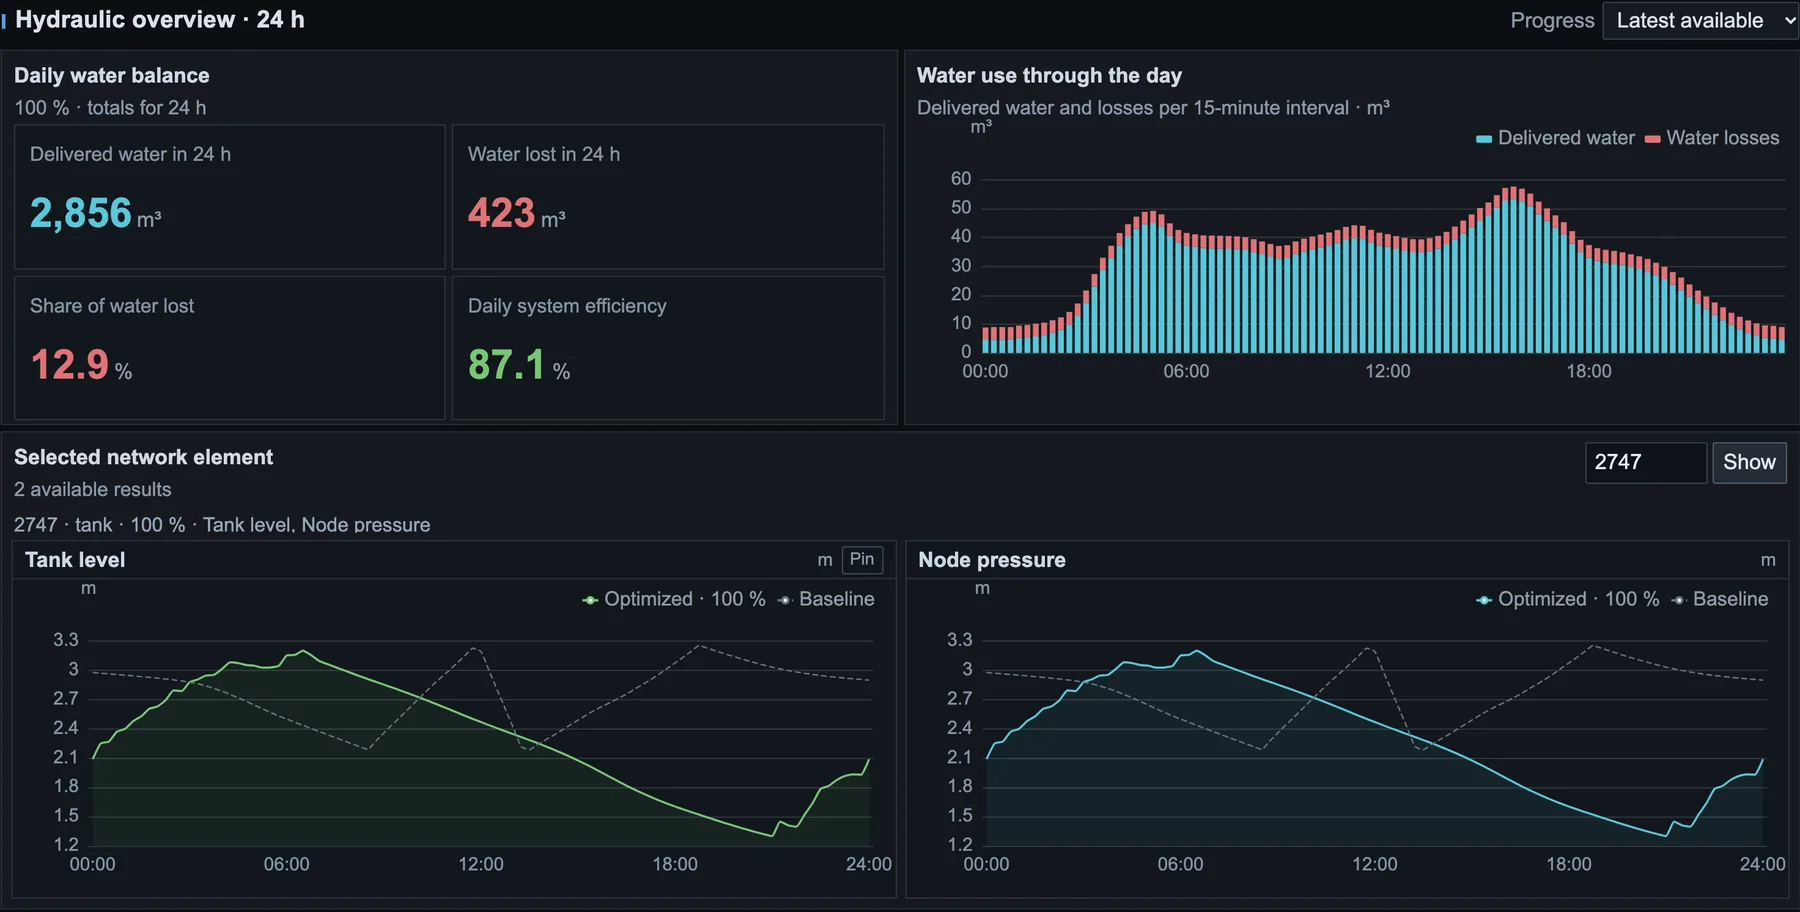
The network stays in EPANET. The OptimAquae dashboard is connected to it and follows every selection.
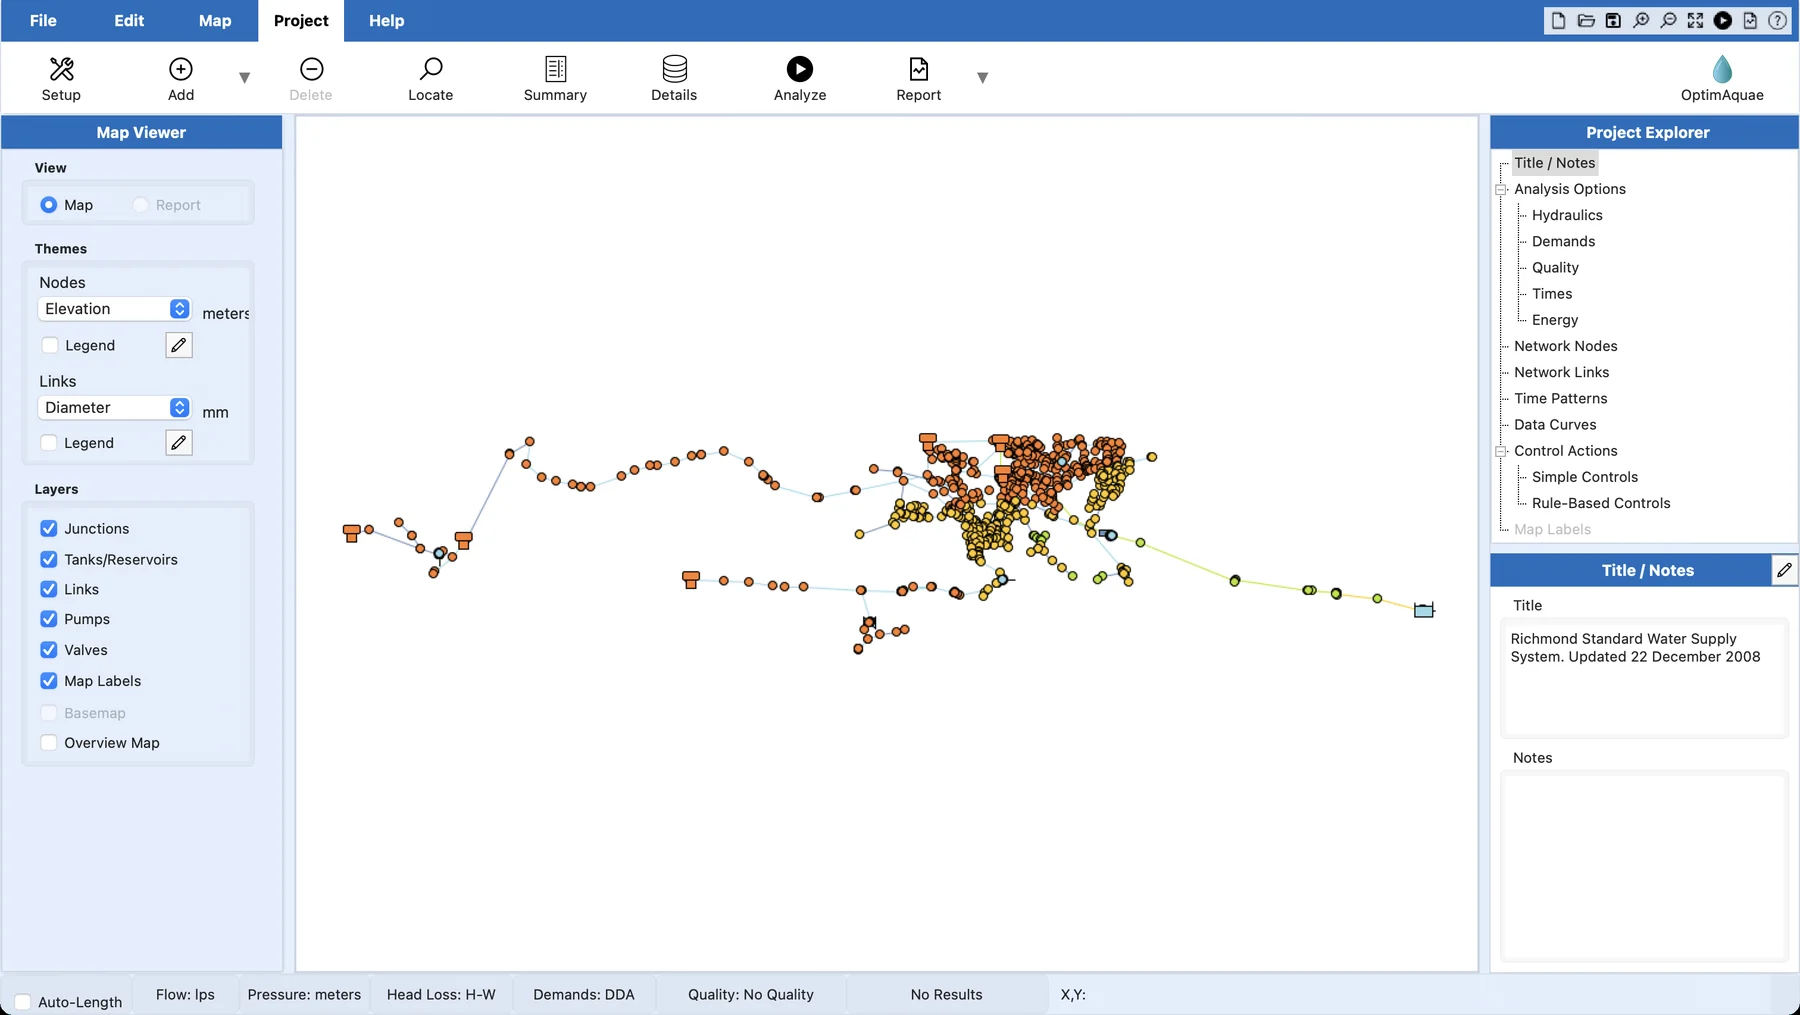
Load the EPANET model and press OptimAquae. The dashboard starts with that model, its name and its element counts.
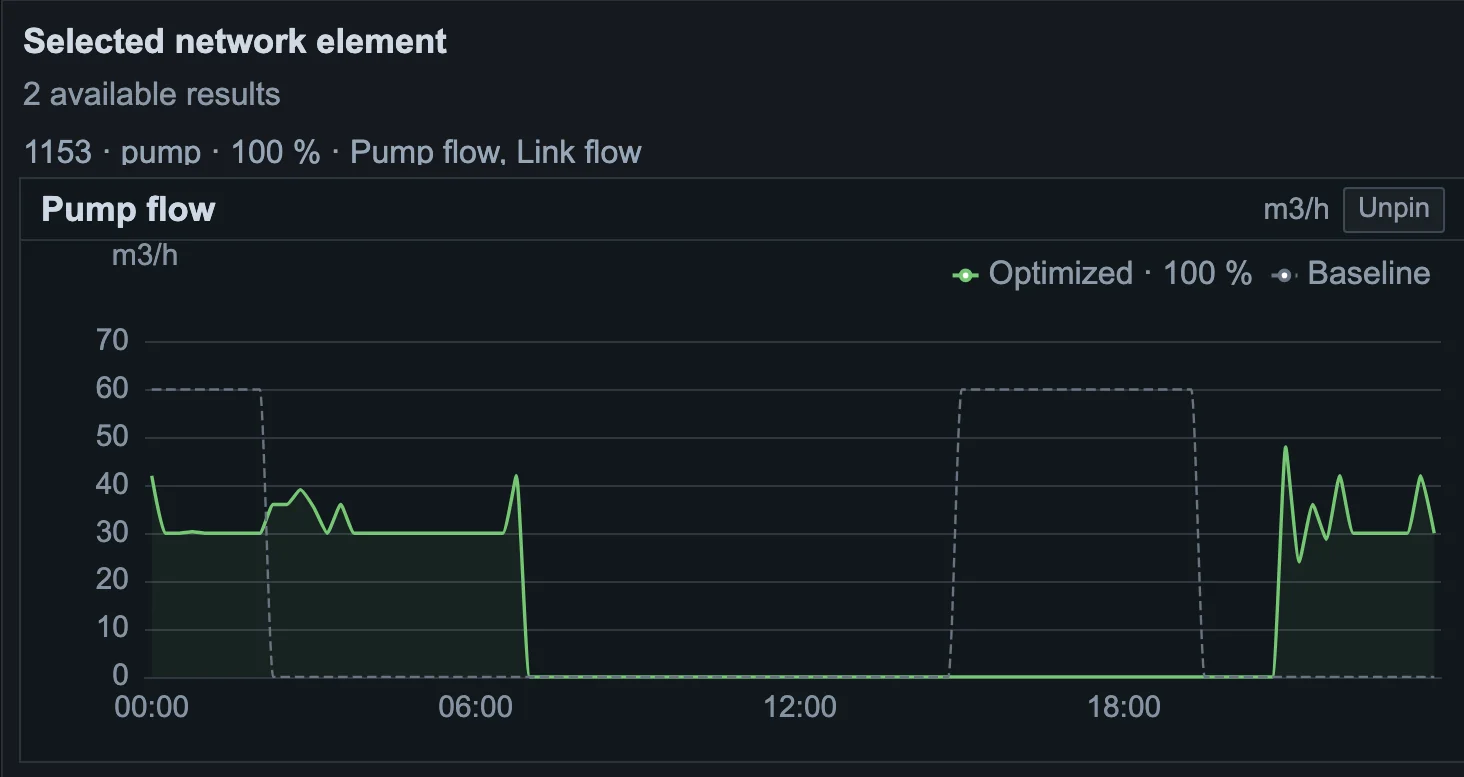
Select a tank, pump, valve, node or pipe in EPANET. The dashboard shows its 24-hour profile at once: current operation and the optimized plan.
Roles set in the dashboard (pump that fills a tank, booster pump, tank inlet valve) are saved as Tags in the network model, so EPANET shows them too.

Benefits

Minimizes physical water loss by optimizing valve and pump operations throughout the distribution network

Lowers pump electricity costs during peak tariff hours, shifting load intelligently.

Ensures required delivery pressure at every consumer node, maintaining strict compliance standards.
Results
| Case Study Network | Network Complexity | Classical Daily Cost | Optimized Daily Cost | Total Cost Savings |
|---|---|---|---|---|
| Illustrative Test System | 15 delivery points, 2 pumps, 1 tank | € 338.38 | € 239.15 | - 29.33% |
| Spanish city (population: 165,000) | 25,266 nodes, 19 tanks, 20 pumps | € 12,284.00 | € 8,549.00 | - 30.41% |
| Croatian city (population: 30,000) | 1,398 nodes, 12 tanks, 26 pumps | € 2,983.00 | € 1,482.00 | - 50.32% |
Total Daily Savings
WDS with 16,624 delivery points and 30,000 m³ daily consumption. Solved 3,379 decision variables in 10 minutes.
| Pumping Cost (Daily) | Classical Operation | Optimized Operation |
|---|---|---|
| Pumping Cost (Daily) | € 3,408 | € 1,693 |
| Water Loss Cost (Daily) | € 8,876 | € 6,856 |
Total Daily Savings
Cut daily operating expenses in half with 4,044 variables optimized in 2 min.
| Pumping Cost (Daily) | Classical Operation | Optimized Operation |
|---|---|---|
| Pumping Cost (Daily) | € 1,844 | € 454 |
| Water Loss Cost (Daily) | € 1,139 | € 1,028 |
Services
Three steps, each with a clear result. After each step you decide whether to continue.
You getA report on your network's savings potential and the next steps
You getMeasured savings on your own network
You getLower operating costs every day
Reliability

Shifts from a rigid 24h plan to a continuous sliding window, reacting dynamically to pipe bursts or sudden demand spikes.

Standard protective hysteresis rules stay active in background to prevent unsafe operations during hardware downtime.

Estimates missing telemetry (e.g. broken tank level sensors) automatically using neighboring network sensor nodes.
Contact
 Email
 Address